Most advertisers trying to reduce CPA make the same mistake: they cut budget. Cutting budget does reduce your absolute spend, but it doesn't lower your cost per acquisition — it just means you acquire fewer customers at the same inefficient rate. Sometimes it makes CPA worse by starving the campaign of the conversion data it needs to optimize.
Sustainable CPA reduction requires identifying the specific variable that's inflating cost and attacking it directly.
The CPA Decomposition Model
CPA isn't a single metric — it's the product of three underlying variables:
CPA = CPC ÷ CVR
Or expanded: CPA = (CPM ÷ (CTR × 1000)) ÷ CVR
This formula reveals that your cost per acquisition is driven by:
- CPM: What you pay per 1,000 impressions (auction competitiveness, quality score)
- CTR: What percentage of impressions become clicks (creative quality, audience match)
- CVR: What percentage of clicks become conversions (landing page, offer strength, audience intent)
A CPA of $45 could be caused by:
- CPM $15, CTR 1.0%, CVR 3.3% → $45 CPA
- CPM $8, CTR 0.5%, CVR 3.6% → $44 CPA
- CPM $20, CTR 2.0%, CVR 2.2% → $45 CPA
All three scenarios produce the same CPA, but the fix is completely different in each case. Improving CTR in the third scenario has no benefit — CVR is the bottleneck. This is why running the decomposition analysis before making any optimization change is not optional.
Industry CPA Benchmarks (Meta Ads, 2025–2026)
Before optimizing, confirm whether your CPA is actually a problem or just unfamiliar. (Source: WordStream, 2025)
| Industry | Average CPA | Good CPA |
|---|---|---|
| Ecommerce (general) | $45 | Under $30 |
| Fashion / Apparel | $35 | Under $22 |
| Health & Wellness | $52 | Under $35 |
| SaaS (trial signups) | $40 | Under $25 |
| B2B (lead generation) | $120 | Under $75 |
| Education | $65 | Under $40 |
| Finance (lead gen) | $95 | Under $60 |
| Real Estate (leads) | $80 | Under $50 |
If your CPA is below the "Good" threshold for your industry, optimization should focus on scaling efficiently rather than cutting cost. If you're above the average, decompose first.
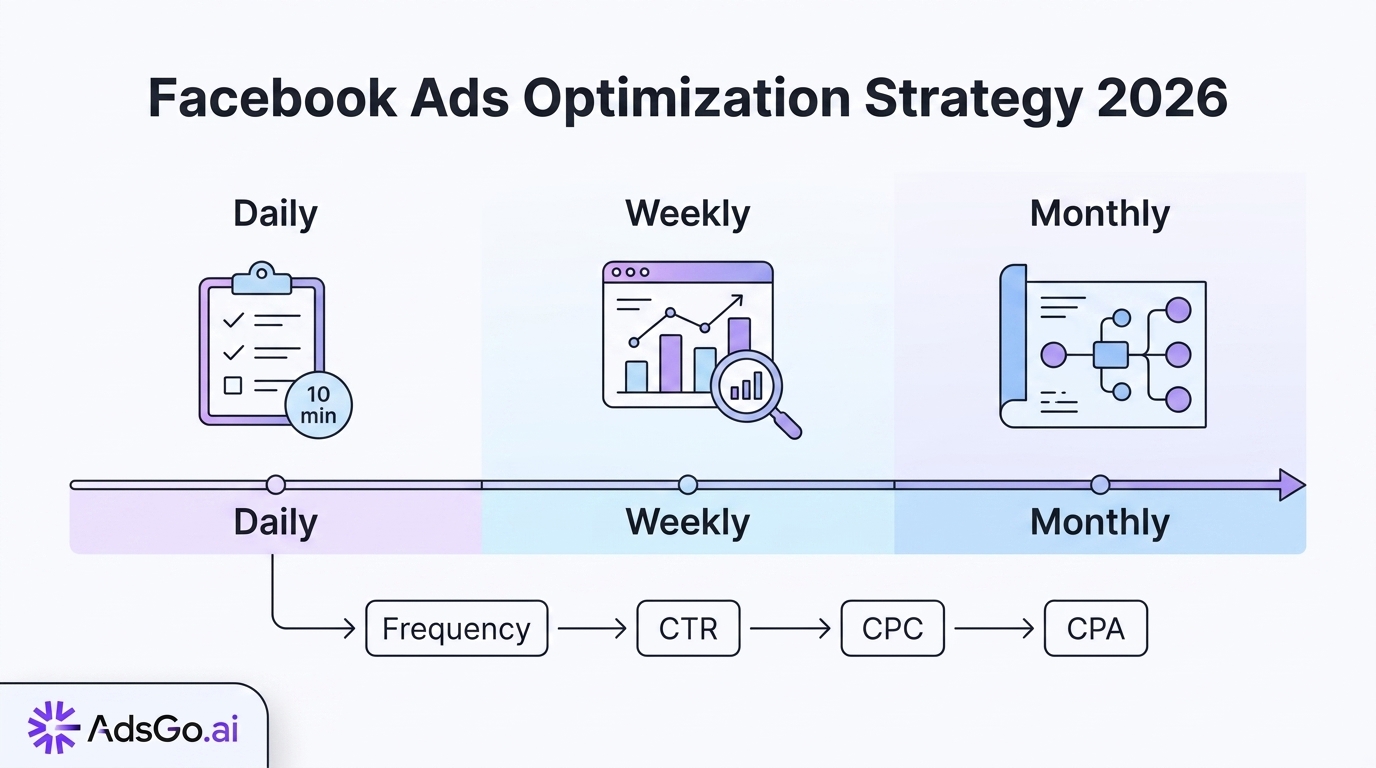
Running the Decomposition Analysis
Pull these metrics from Ads Manager for a 14-day window:
- CPM (cost per 1,000 impressions)
- CTR — Link Click-Through Rate
- Landing Page View Rate (Landing Page Views ÷ Link Clicks)
- Purchase Conversion Rate (Purchases ÷ Landing Page Views)
- CPA (actual cost per purchase)
Calculate which factor has the most room for improvement relative to benchmarks. Then focus exclusively on that variable for the next 2 weeks before layering in additional changes.
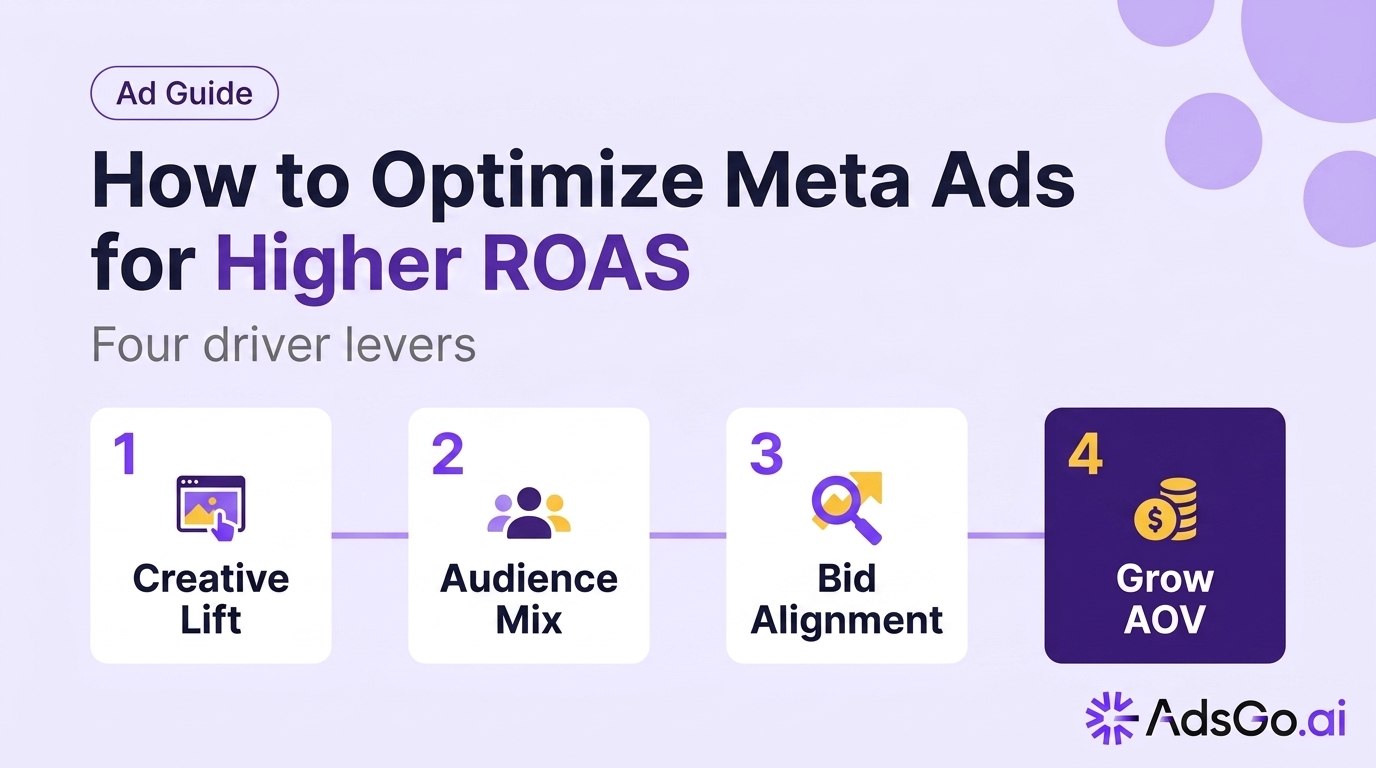
The 5 CPA Reduction Levers
Lever 1: Reduce CPM Through Creative Quality Improvement
Your ad quality score — Meta's assessment of how relevant and valuable your ad is to the audience — directly affects your effective bid in the auction. A higher quality score means you win more auctions at lower clearing prices, reducing CPM without changing your bid.
Ad quality is improved by: increasing CTR (users engaging positively with the ad), reducing "Hide Ad" and "Report Ad" signals, and ensuring strong landing page experience signals (low bounce rate, time on page).
The single highest-leverage action for CPM reduction: refresh creative before Meta's quality score begins to decline, not after. In our analysis of 500+ Meta ad accounts at AdsGo, accounts that refreshed creative at the first sign of CTR decline (frequency 2.0, CTR down 15% from peak) had CPMs 22% lower than accounts that refreshed after full creative fatigue set in. (based on AdsGo internal campaign data)
Lever 2: Improve CTR to Compress CPC
CTR improvement has a direct mathematical effect on CPC (CPC = CPM ÷ (CTR × 1000)). Doubling CTR halves CPC at constant CPM.
The highest-leverage CTR improvements:
- Hook optimization (first 3 seconds of video, first frame of image)
- Headline specificity (specific numbers, specific audiences, specific outcomes)
- Creative format testing (video vs. static vs. carousel for your specific offer)
Priority order: test hooks first (highest impact), then headlines, then format. Don't test all three simultaneously — it prevents attribution.
Lever 3: Improve CVR Through Landing Page and Offer Optimization
Conversion rate improvement is the highest-leverage CPA lever when CTR is already at benchmark or above. A CVR improvement from 2% to 4% halves CPA without changing ad spend, audience, or creative.
The highest-impact CVR improvements for cold traffic:
- Page load speed reduction (every 100ms reduction improves CVR by ~1%) (Source: Deloitte Digital)
- Headline alignment between ad and landing page (the ad's promise must be the page's first statement)
- CTA clarity (one action per page, above the fold, with urgency or scarcity when genuine)
- Social proof density (reviews, case studies, trust badges within the first scroll)
For warm retargeting traffic, the highest-impact CVR improvement is reduced friction: pre-populated checkout fields, saved payment methods, and offer specificity ("The exact items you viewed are still available").
Lever 4: Refine Audience to Higher-Intent Segments
Not all audience segments convert at the same rate. Interest audiences may generate high CTR but low CVR because they're early-awareness users. Lookalike audiences of recent purchasers tend to generate higher CVR because behavioral similarity predicts purchase intent.
Segment analysis: break down your CPA by audience segment (age, gender, device, placement) in Ads Manager Breakdowns. Identify the segments where CPA is at or below target. Allocate more budget to those segments and reduce budget for underperforming segments.
One specific finding from our campaign analysis: mobile-only traffic frequently shows 30–40% higher CPA than desktop traffic for products with complex checkout flows. Excluding mobile placements or creating a simplified mobile landing page often reduces blended CPA significantly. (based on AdsGo internal campaign data)
Lever 5: Optimize Bidding Strategy for Conversion Efficiency
The wrong bidding strategy for your campaign's maturity level inflates CPA. New campaigns with limited data should use Lowest Cost (no cap) to build conversion data. Mature campaigns with 50+ weekly conversions can effectively use Cost Cap or Bid Cap to set a ceiling on acceptable CPA.
Applying a cost cap too early — before Meta has sufficient conversion data to find efficient users — causes the algorithm to either bid too conservatively (missing conversions) or bid inefficiently (overpaying for the limited inventory it can access at cap).
Timing for cost cap introduction: after 4+ weeks of Lowest Cost bidding with consistent weekly conversion volume above 50 events, and only when your Lowest Cost CPA has stabilized (less than 15% week-over-week variation).
Ready to Launch Smarter Campaigns?
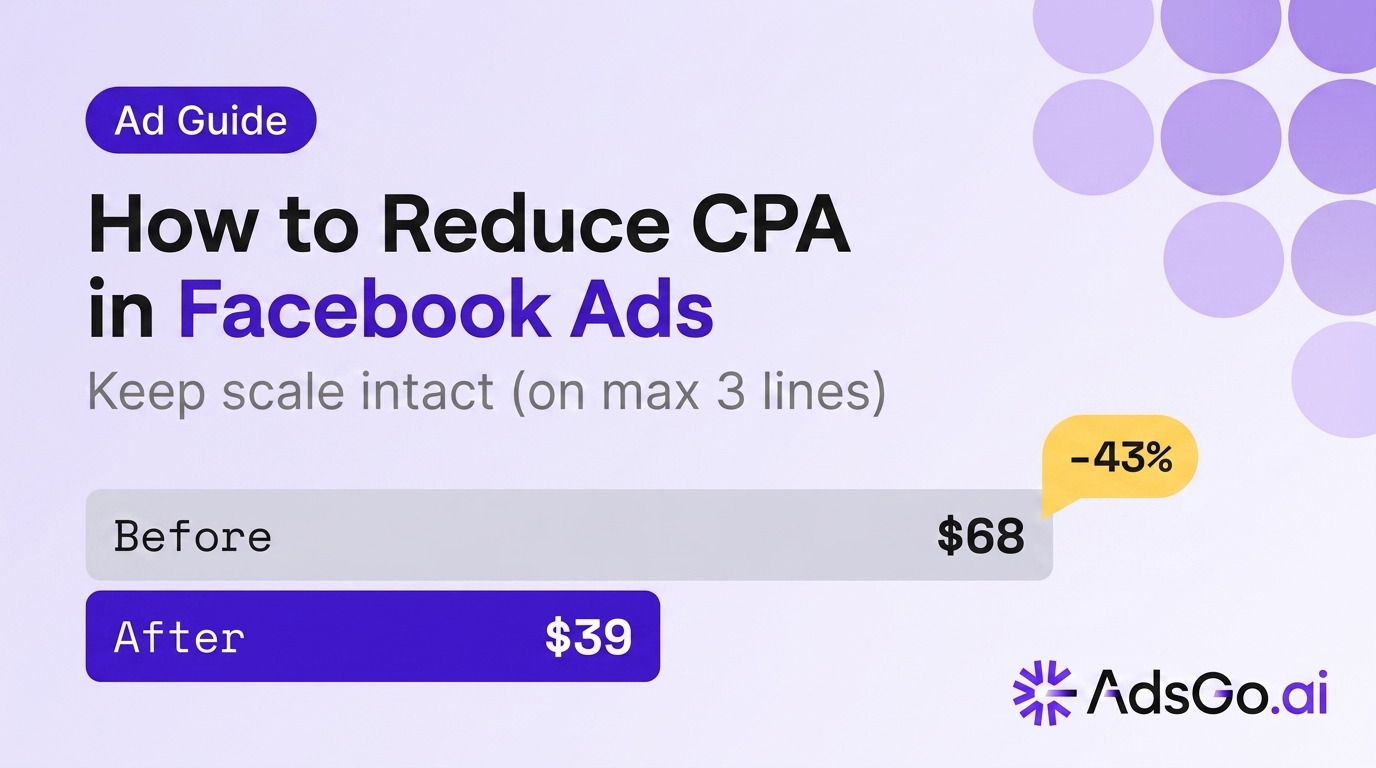
Case Study: -42% CPA Breakdown
A mid-market ecommerce brand managing $15,000/month in Meta spend came to AdsGo with a CPA of $68 against a $40 target. Decomposition analysis revealed:
| Metric | Baseline | Benchmark | Gap |
|---|---|---|---|
| CPM | $14.20 | $9–12 | Elevated |
| CTR | 0.91% | 1.2–1.8% | Below benchmark |
| CVR | 2.1% | 2.5–3.5% | Below benchmark |
CPM was elevated due to creative fatigue (frequency 4.2, quality score declining). CTR was below benchmark due to an outdated hook format. CVR was below benchmark due to a 5.8-second mobile page load time.
Actions taken over 4 weeks:
- Week 1: New creative with hook testing — CTR improved to 1.7%
- Week 2: Landing page speed optimization — CVR improved to 3.2%
- Weeks 3–4: Budget reallocation to Lookalike audiences — CPM normalized to $10.80
Result: CPA dropped from $68 to $39 — a 42.6% reduction — while spend remained constant and weekly conversion volume increased by 74%.
CPA creeping up across your Facebook campaigns? AdsGo identifies and fixes the highest-impact cost drivers. → Try AdsGo free
How AdsGo Automates CPA Optimization
The CPA decomposition analysis described above requires pulling data from multiple Ads Manager views, calculating derived metrics, and tracking changes over time. For accounts running 10+ campaigns, this is a significant manual overhead.
AdsGo's ad insight dashboard automatically runs the decomposition analysis across all active campaigns, surfacing which lever (CPM, CTR, or CVR) is the primary CPA driver and ranking optimization opportunities by expected impact.
AdsGo's AI optimization system implements bid adjustments, budget reallocation, and creative refresh triggers automatically when CPA trends above target — maintaining efficiency without requiring manual campaign intervention for each adjustment cycle. (based on AdsGo internal campaign data)
FAQ
What's the fastest way to reduce Facebook ads CPA?
The fastest CPA reduction lever is usually landing page CVR improvement, because it doesn't require campaign changes, creative production, or waiting for new learning data. If your page load time is above 3 seconds, fixing it often produces a 20–30% CVR improvement within 48 hours. Run your page through Google PageSpeed Insights today.
Will reducing my Facebook budget reduce my CPA?
No. Budget reduction reduces total spend and total conversions, but your cost per conversion typically stays the same or worsens (because you're giving the algorithm less data to optimize with). The only exception is if you're currently in audience saturation — reducing budget while expanding audience can simultaneously lower CPM and CPA.
How long does it take to see CPA improvement after making changes?
Allow 7–14 days after any significant change before evaluating results. Meta's algorithm needs to adjust to new creative, audiences, or bid strategies, and early data is noisy. Making multiple changes simultaneously makes it impossible to attribute which change drove the improvement.
Is a lower CPA always better?
Not necessarily. A CPA of $20 sounds better than $35, but if the $35-CPA customers have 3× higher lifetime value or larger average order values, the $35 CPA is more profitable. Focus on CPA relative to your customer LTV and margin, not just absolute cost.
What's the difference between CPA and ROAS for measuring Facebook ad efficiency?
CPA measures cost per individual conversion regardless of order value. ROAS measures return on ad spend relative to revenue generated. For ecommerce with variable order values, ROAS is more meaningful. For lead generation with uniform lead values, CPA is simpler. For businesses with high variance in order value, tracking both metrics gives the most complete efficiency picture.